1. Compare Differential CpG Analysis Tools
Program |
Input data |
Method/Model |
Co-variable |
dmc_fisher.py |
Proportion value (RRBS/WGBS) |
Fisher’s exact test |
No |
dmc_logit.py |
Proportion value (RRBS/WGBS) |
Logistic regression |
Yes |
dmc_bb.py |
Proportion value (RRBS/WGBS) |
Beta-binomial regression |
Yes |
dmc_ttest.py |
Beta- or M-value (450K/850K) |
Student’s T-test |
No |
dmc_glm.py |
Beta- or M-value (450K/850K) |
Generalized linear model |
Yes |
dmc_nonparametric.py |
Beta- or M-value (450K/850K) |
Mann–Whitney U test or Kruskal-Wallis H test |
No |
dmc_Bayes.py |
Beta- or M-value (450K/850K) |
Bayes estimation |
No |
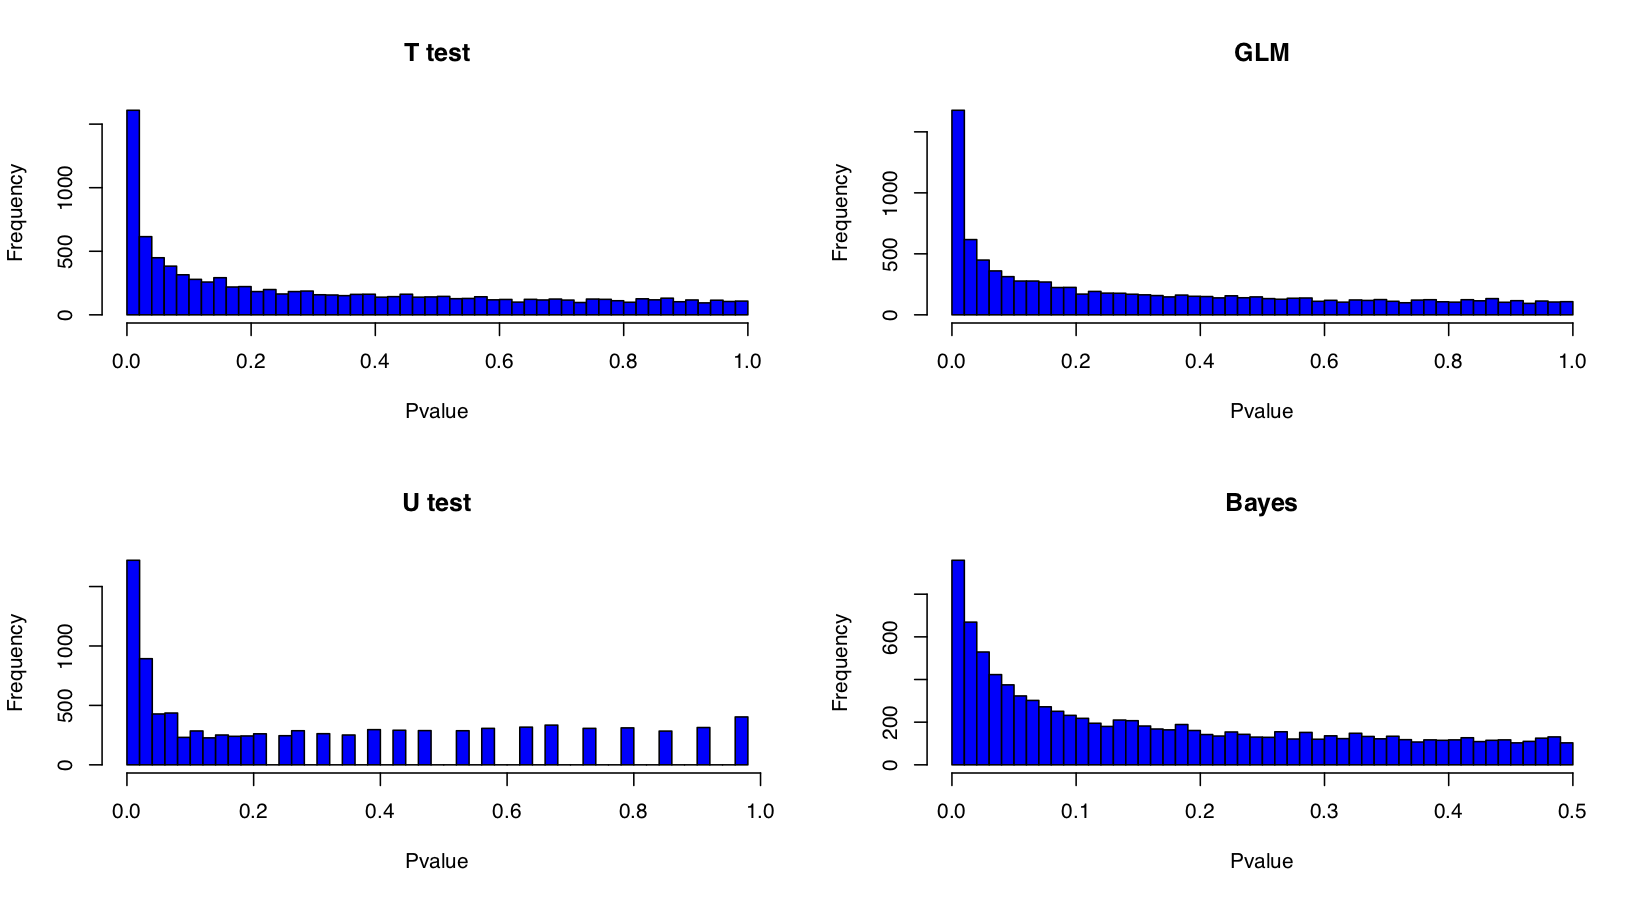
2. P-value distributions
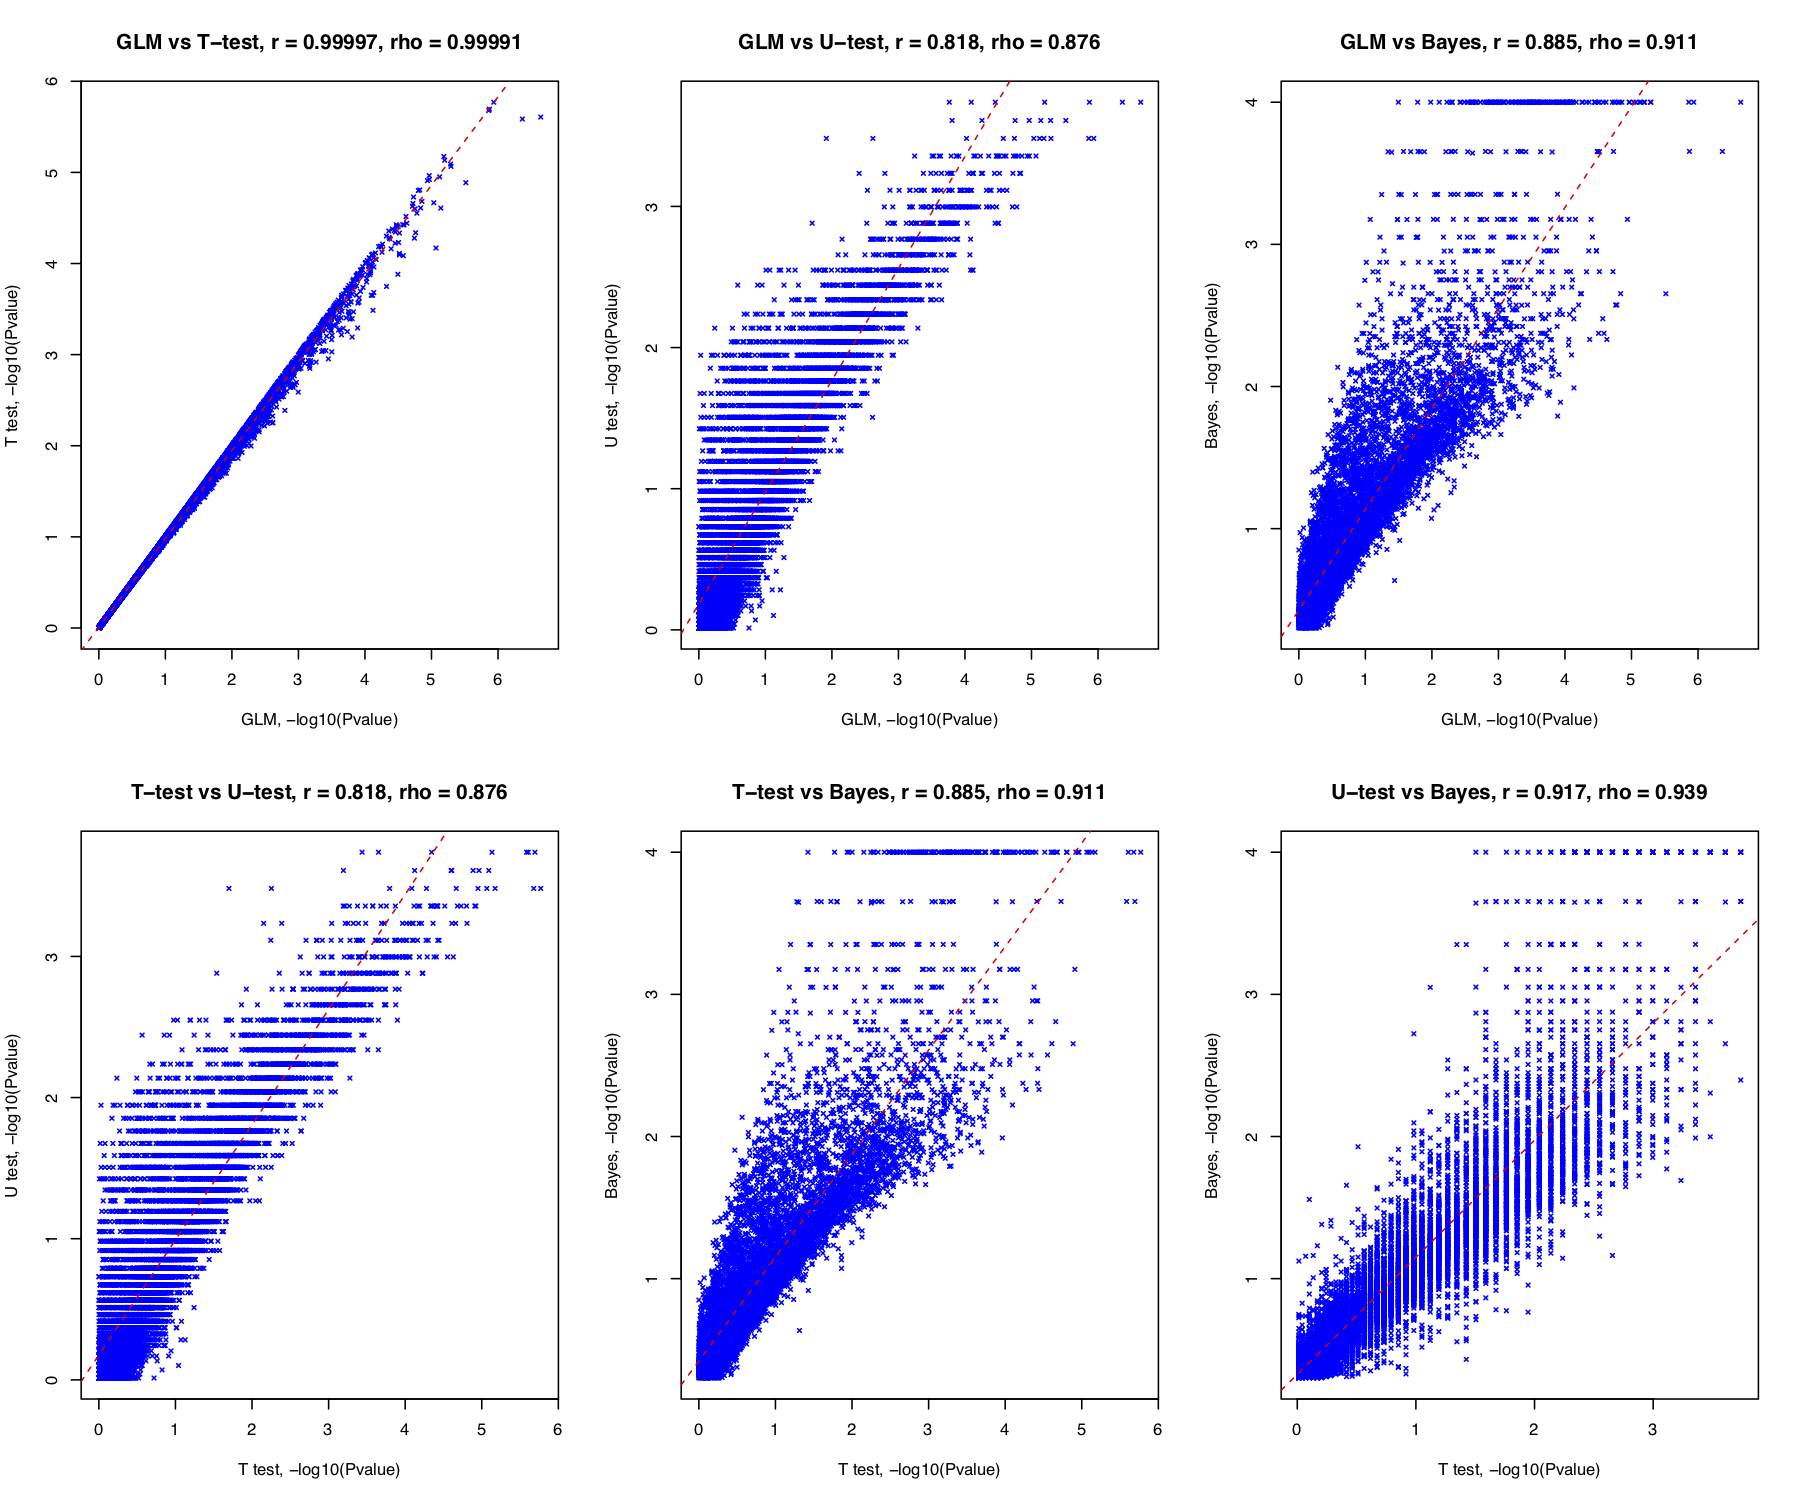
Compare p-value distributions of dmc_ttest.py, dmc_glm.py, dmc_nonparametric.py (U test), and dmc_Bayes.py
Correlation of p-values of dmc_ttest.py, dmc_glm.py, dmc_nonparametric.py (U test), and dmc_Bayes.py