10. beta_jitter_plot.py
10.1. Description
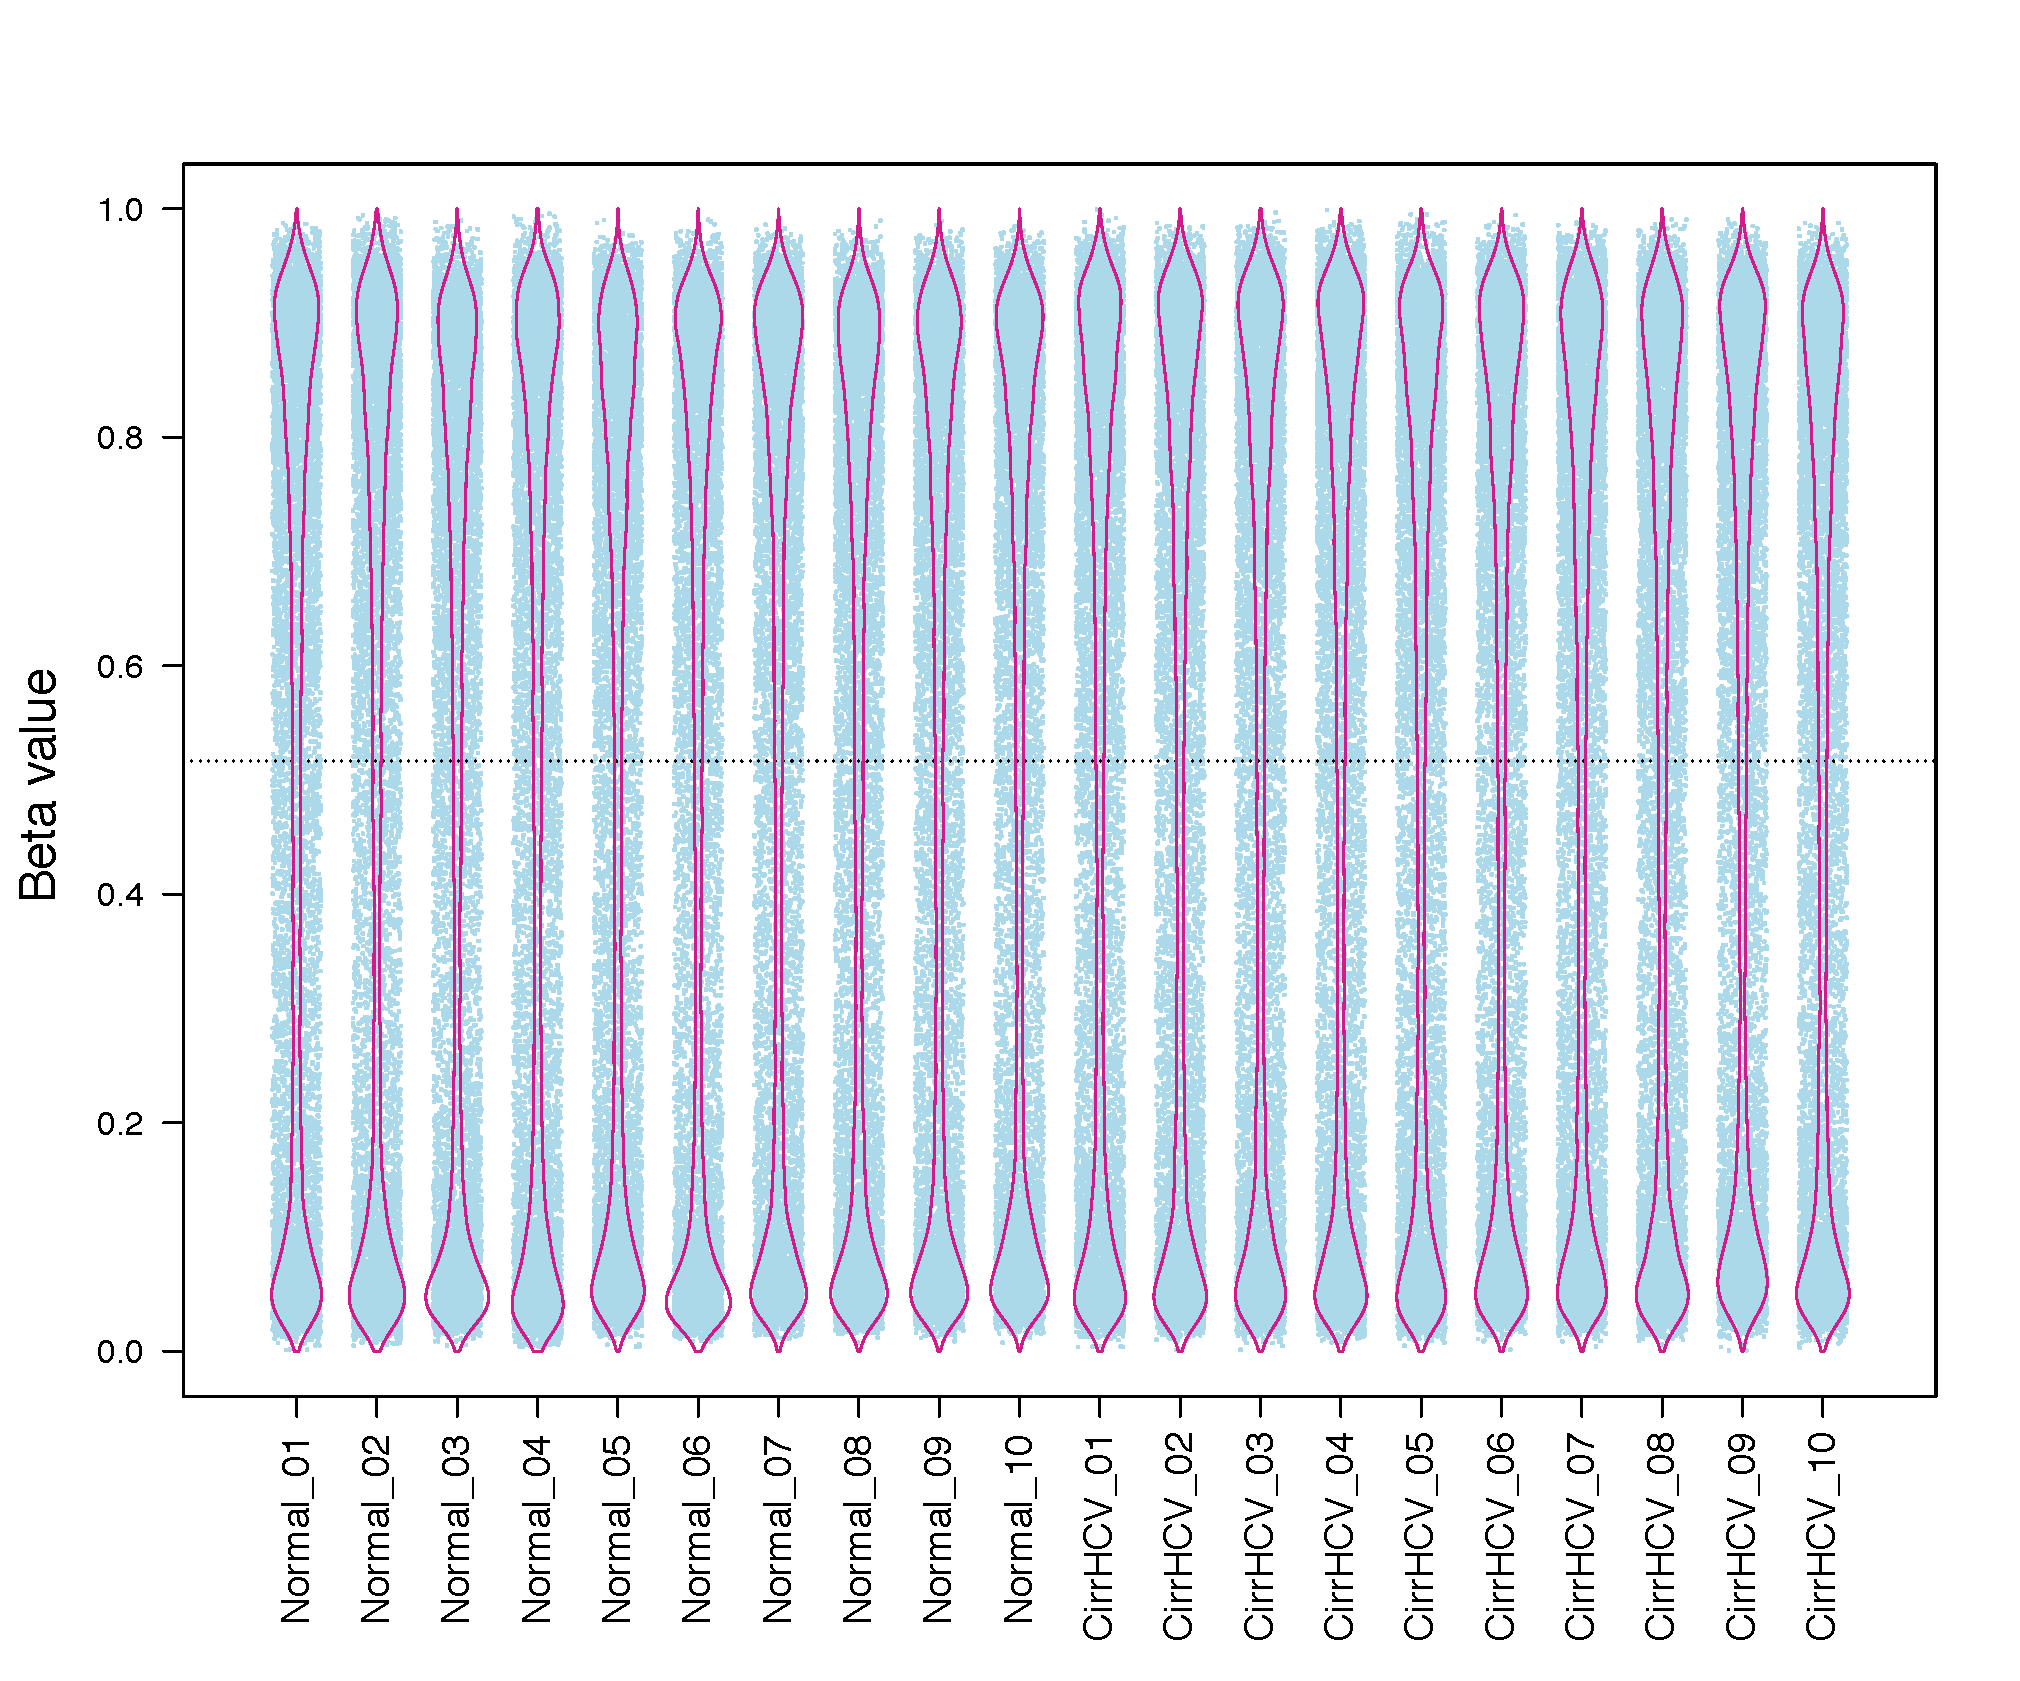
This program generates jitter plot (a.k.a. strip chart) and bean plot for each sample (column)
Example of input
CpG_ID  Sample_01       Sample_02       Sample_03       Sample_04
cg_001  0.831035        0.878022        0.794427        0.880911
cg_002  0.249544        0.209949        0.234294        0.236680
cg_003  0.845065        0.843957        0.840184        0.824286
Notes
User must install the beanplot R library.
10.2. Options
- --version
show program’s version number and exit
- -h, --help
show this help message and exit
- -i INPUT_FILE, --input_file=INPUT_FILE
Tab-separated data frame file containing beta values with the 1st row containing sample IDs and the 1st column containing CpG IDs.
- -f FRACTION, --fraction=FRACTION
The fraction of total data points (CpGs) used to generate jitter plot. Decrease this number if the jitter plot is over-crowded. default=0.5
- -o OUT_FILE, --output=OUT_FILE
The prefix of the output file.
10.3. Input files (examples)
10.4. Command
$beta_jitterPlot.py -f 1 -i test_05_TwoGroup.tsv.gz -o Jitter